The Hidden Metrics That Can Make or Break Your Climate Tech Startup

Jan 12, 2022
The Hidden Metrics That Can Make or Break Your Climate Tech Startup
Why every deep tech climate founder should be familiar with their unit economics.
You probably didn’t start your company to obsess over techno-financial assumptions. But if you’re building in climate, especially anything involving materials, energy, or manufacturing, then techno-economic analysis (TEA) is a mandatory requirement—even if you’re not a technical founder.
The only fatal error in an early-stage venture is lying to yourself about your numbers. Most founders in climate tech know they’ll need a TEA eventually—usually around a Series A, when investors want to see that your solution has the potential to compete against existing technologies in the market. But TEA is more than checking a box, if done correctly, your TEA modelling should drive:
R&D experimental design – what parameters e.g. yield, conversion, efficiency is required for the technology to have a chance of commercial success
Business case development – which feedstock/product selection provides the most economic potential
Capital raising – what capital expenditure (CAPEX), operational expenditure (OPEX) are required to deploy your solution at scale
Scale-up design– at which scale does your technology provide a solution that is competitive in comparison to the rest of the market
Benchmarking – what is your levelized cost of production – how does it compare to business as usual (BAU)
Partnerships– understanding how your solution will work at a chosen site and scale will allow you to drive commercialisation dialogue with industry partners.
In this article, I’ll walk through a simple TEA approach based on the approach taken from Towler & Sinnott’s text Chemical Engineering Design.
First: What’s the point of a TEA?
A good TEA does three things for an early stage venture:
It defines your levelised cost of production (LCOP)—the true, all-in cost per unit at scale, factoring in capital and operating costs over time. This will indicate whether or not you have a feasible business.
It tells you where your cost levers are—and what it takes to hit price parity with incumbents.
If you’re pre-revenue, your TEA is your selling tool. It’s what investors, partners, and customers will use to judge your commercial potential.
The 5-Step TEA (Based on Towler & Sinnott)
Here’s a playbook for you to use, adapted from Chemical Engineering Design:
1. Build a basic process model
Start with your process flow diagram. Some questions to get you started:
How much raw material goes in?
How much product comes out?
What is your equipment selection?
What are the key material flows through the key pieces of equipment?
What are the key energy inputs for each of the unit operations e.g. reactor tanks, filters, pumps
Don’t overcomplicate it—the whole point of this exercise is to use the throughput/scale for each piece of equipment to calculate capital cost (CAPEX), and operational cost (OPEX) estimates.
(We would be happy to help you out with this step on a free consultation call)
Estimate total investment cost
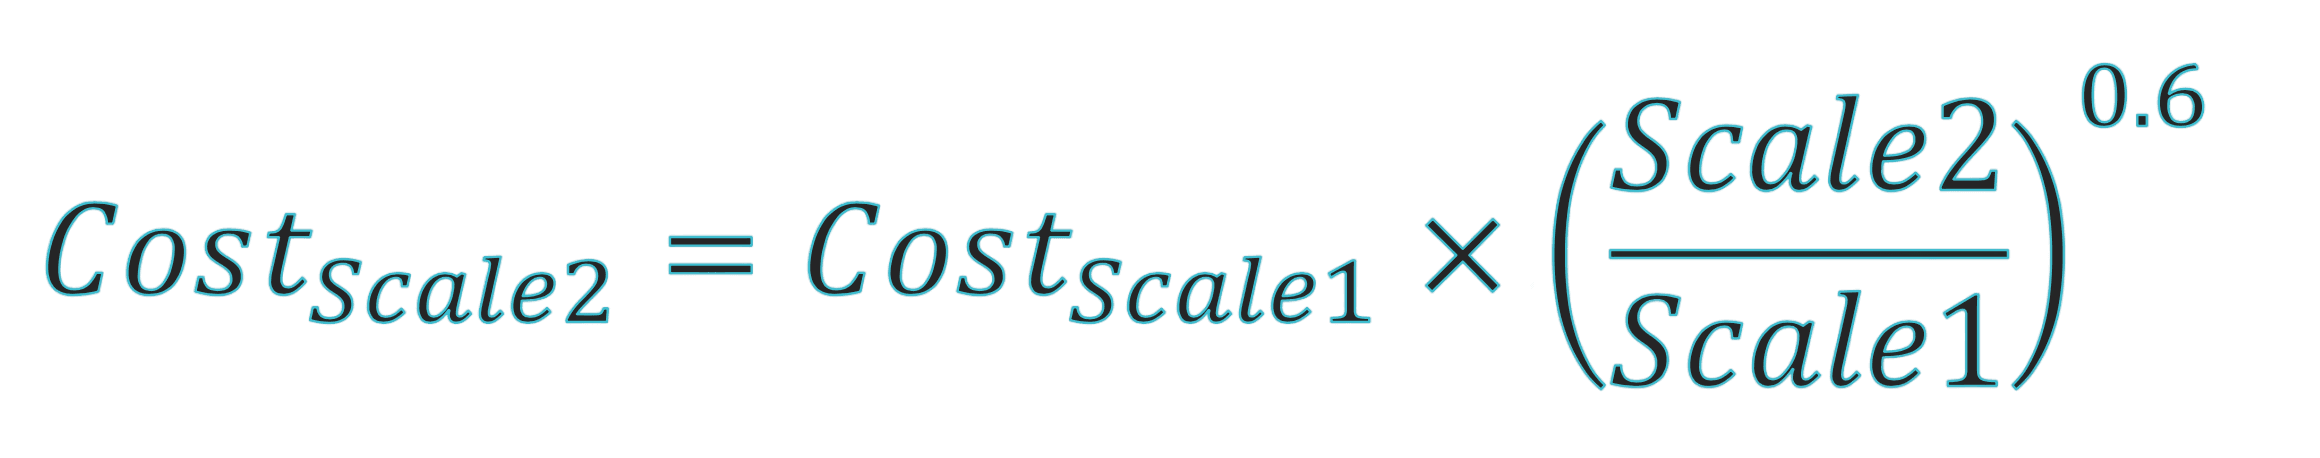
Start with equipment purchase costs. If you’re unable to source data for equipment at the scale you require, you can use scaling factors to estimate based on an reference cost. Scaling factors adjust the cost of equipment based on economies of scale. Typically, larger units are lower cost relative to a linear size increase.
For example, if you find the cost of a unit is $10,000 at a scale of 100m3/d flow, but your process needs to estimate it at a flow of 200m3/d, the CAPEX can be approximately determined by:
(using a scaling factor of 0.6)
The sum of Equipment Purchase costs gives the ISBL (inside battery limits) cost of the plant. This is a fancy term for the cost of equipment within the boundary of the facility itself (Σ Equipment Purchase costs).
On top of the ISBL cost, the capital cost estimate needs to account for erection, piping, instrumentation, control, electrical, civil, structural, lagging and paint charges. Other contributions to the installation factor include offsite infrastructure charges, fees for engineering services, and contingency costs.
This means the actual installed CAPEX ends up being 4-6x higher depending on whether the process involves fluids or solids.
Installation factors:
Processes with fluids: 6.00
Processes with solids: 4.55
Hybrid processes with fluids and solids: 6.05
e.g. for a process with only fluids,
Total fixed capital = Σ Equipment Purchase Costs x 6.00
The final step to estimate project fees is to add working capital to start up the plant and run it until it can generate income. This covers cash on hand, and inventory. Depending on how complex the process is, this factor can vary between 5-30%.
Total investment cost = Total fixed capital + Working Capital
(assuming 15% working capital)
Total investment cost = Total fixed capital x 1.15
To be continued…